
Fixed Tilt vs Single-Axis Solar Tracker: How to Choose for a Ground-Mount PV Project?
Choosing between fixed tilt and a single-axis solar tracker is not simply a question of which system produces more energy.
Tracking can increase solar generation by changing module orientation during the day. Fixed tilt avoids the drives, moving mechanisms, and tracker controls required to do that. But the better project depends on whether the tracker’s additional usable lifetime energy creates enough value to justify its incremental cost, operational requirements, and site-specific risks.
Same site. Same boundary. Same assumptions. Then compare.
Published tracker-yield percentages or generic fixed-tilt cost claims can be useful as background, but they should not be treated as project forecasts unless their site, system, and financial assumptions match the project being evaluated.
| Decision Factor | What You Actually Need to Compare |
| Energy | Same-site modeled generation and incremental usable energy |
| Land | MWdc/acre, kWh/kWp/year, and MWh/acre/year |
| Terrain | Layout geometry plus actual civil and foundation requirements |
| Cost | Same-scope CAPEX and lifecycle OPEX |
| Grid | Usable/exportable energy, not modeled generation alone |
| O&M | Maintenance requirements, failure consequences, and evidence |
| Weather | Project loads and verified structural/stow behavior |
| Economics | Incremental lifetime value versus incremental cost and risk |
Editorial disclosure: EASYSOLAR supplies fixed-tilt solar mounting systems and does not supply solar trackers. Tracker-related technical statements in this guide rely primarily on independent third-party sources. The EASYSOLAR project example is identified separately as first-party implementation evidence and is not used to claim that fixed tilt universally outperforms tracking.
Fixed Tilt vs Single-Axis Tracker: What Actually Changes?
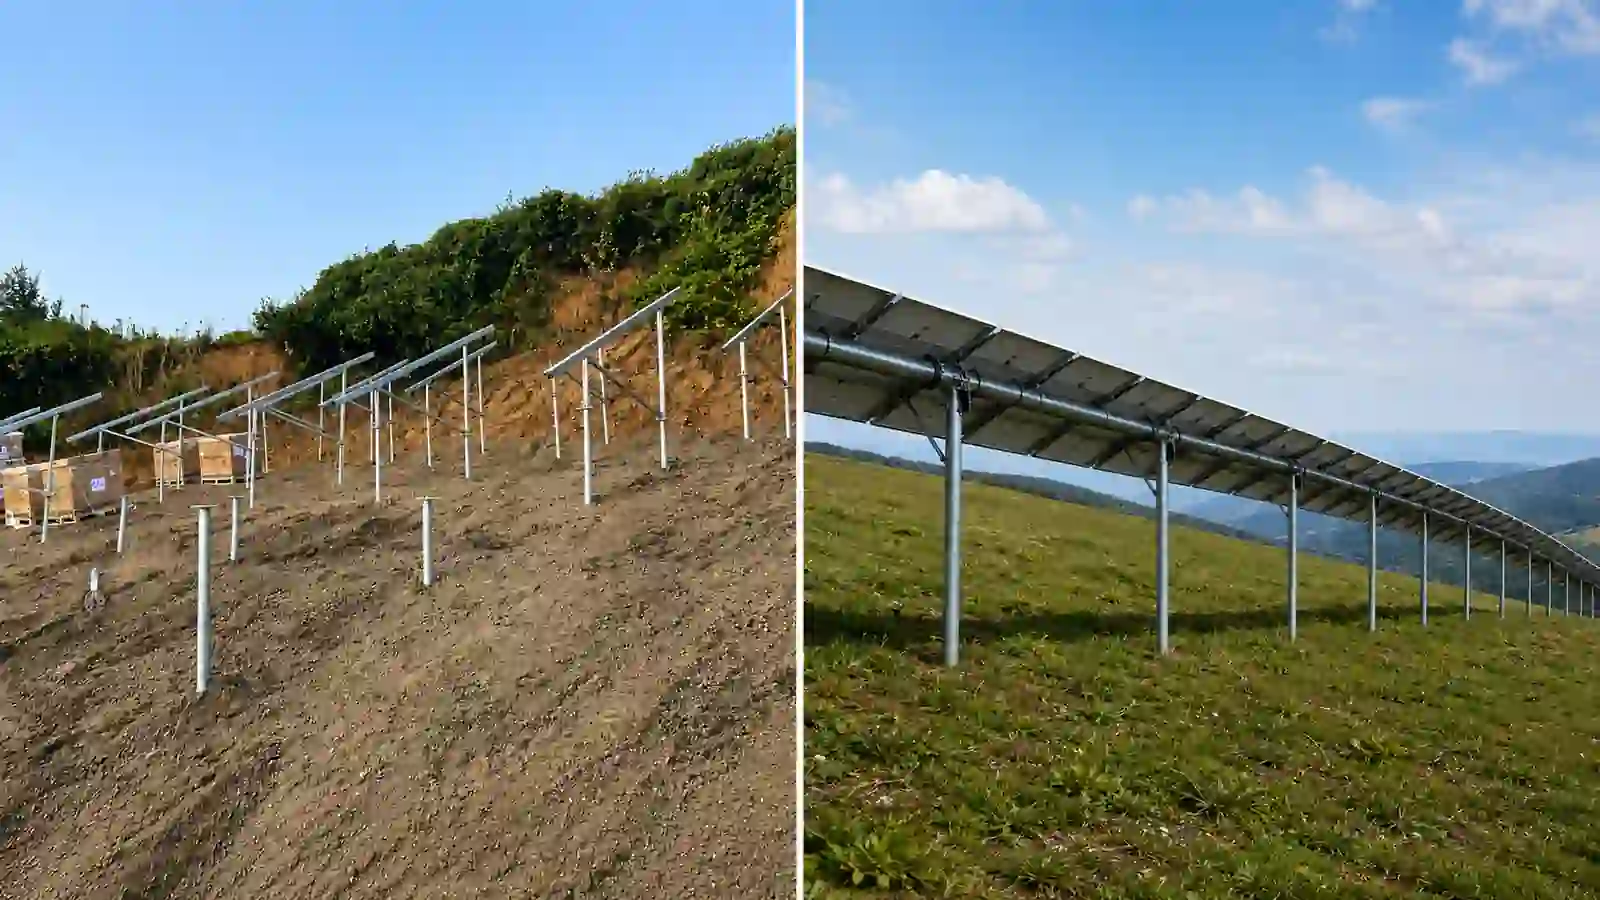
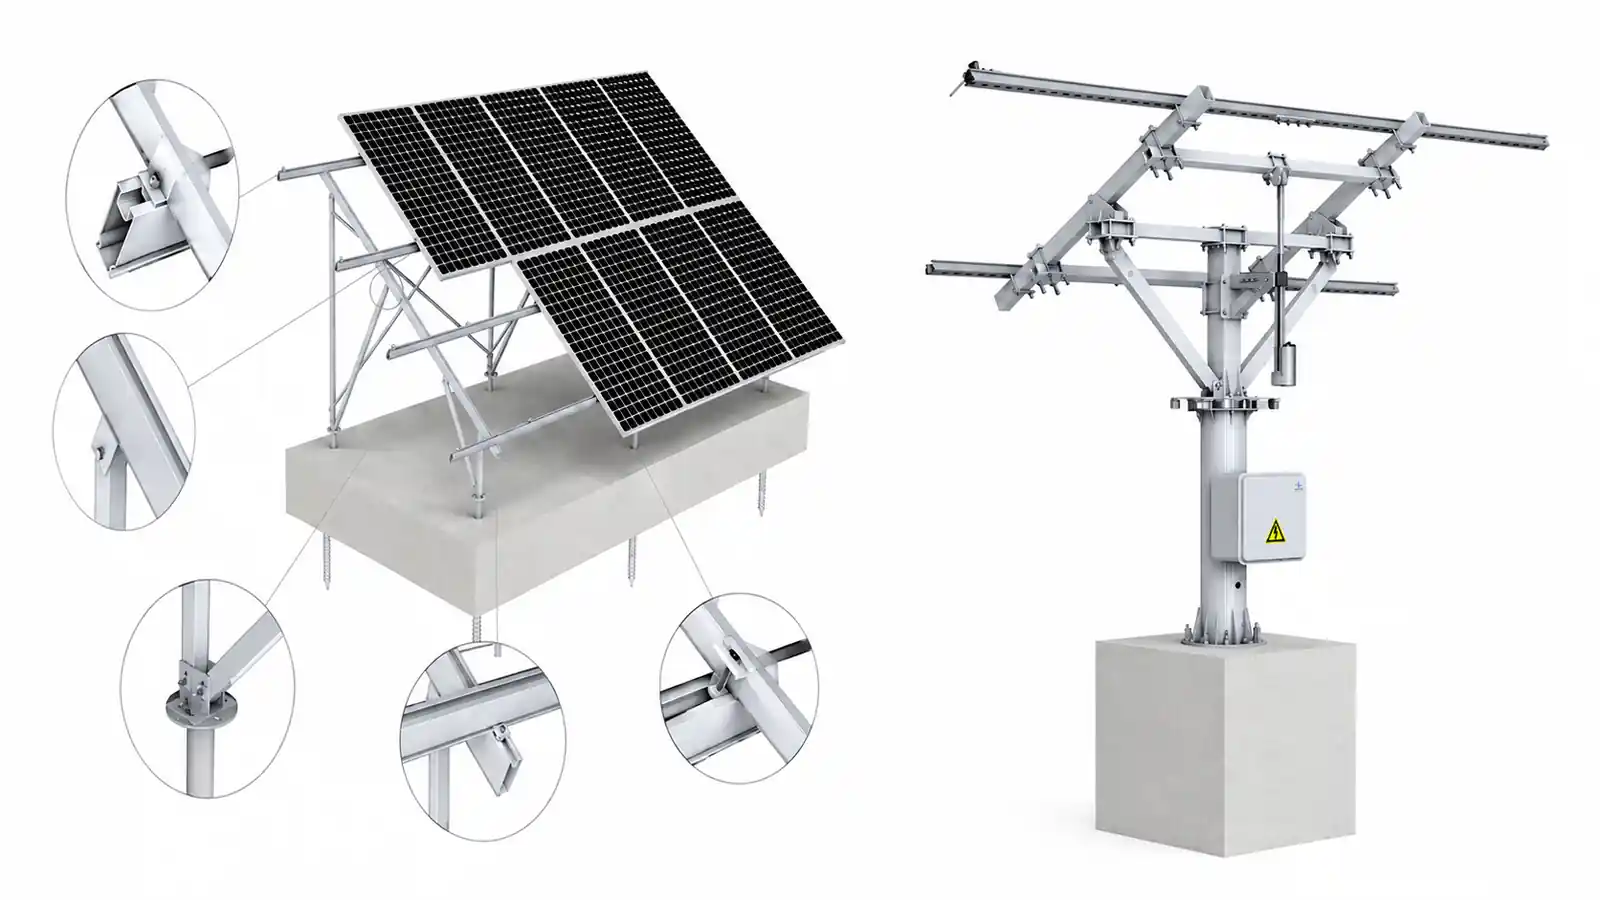
A fixed-tilt mounting system holds PV modules at a fixed operating orientation after installation.
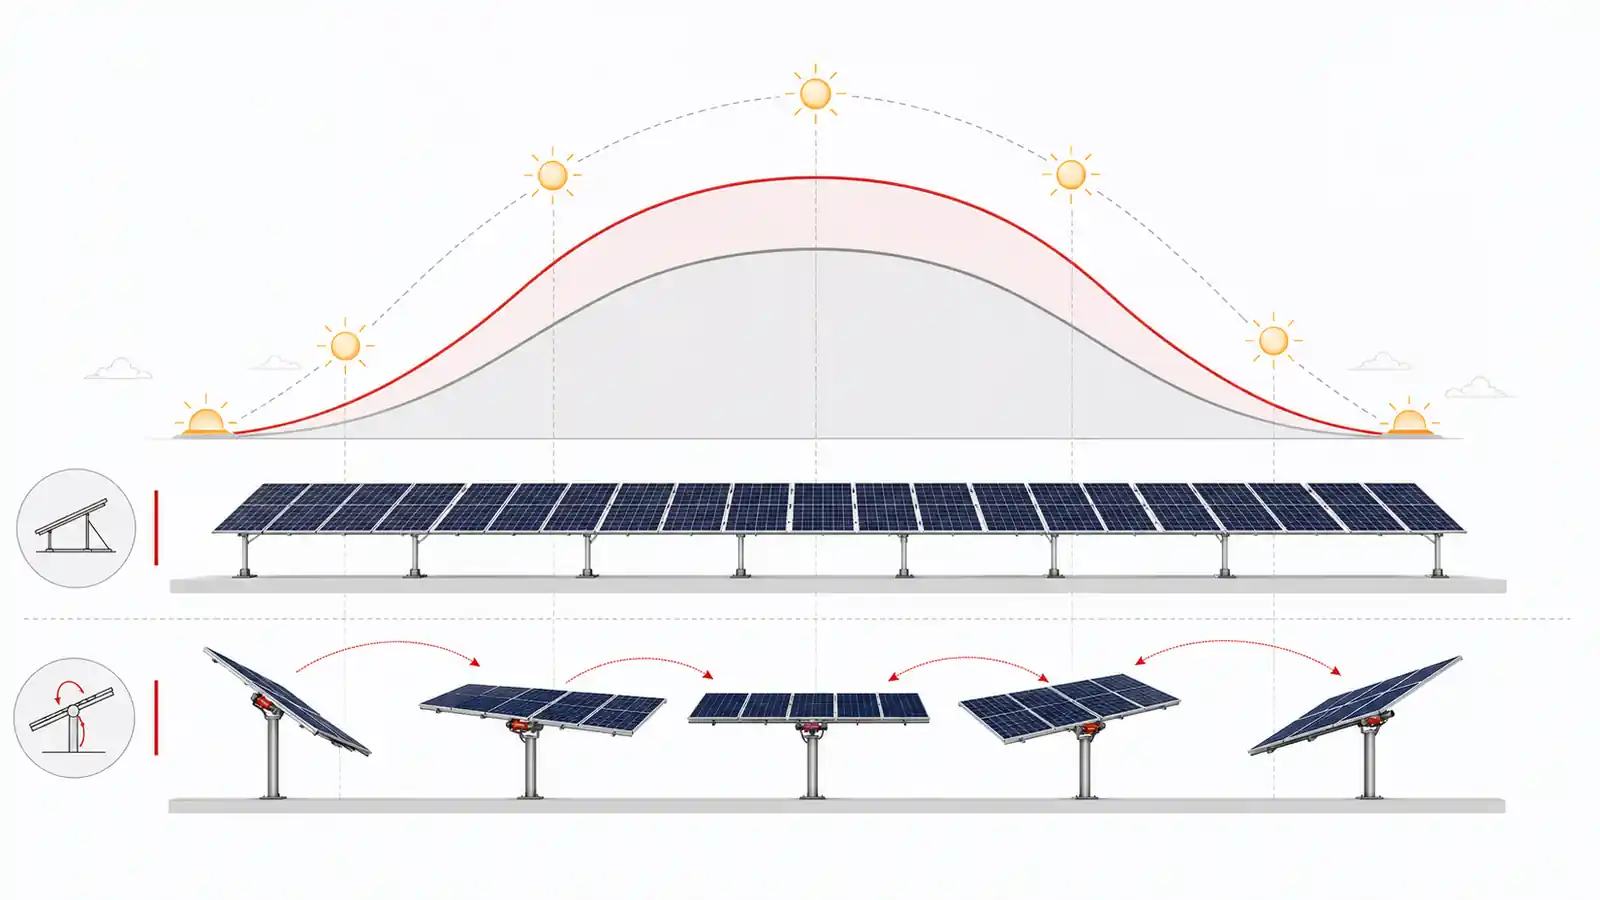
A single-axis tracker[1] rotates the modules around one axis during the day. Horizontal single-axis tracking commonly uses a roughly north-south axis so modules can rotate east and west as solar position changes. Many tracker systems also use backtracking, which alters tracker position at low solar elevations to reduce row-to-row shading. Sandia’s PV Performance Modeling Collaborative notes that backtracking calculations depend on solar position and array geometry, including ground coverage ratio (GCR).
The tracker therefore introduces movement and control functions that a fixed-tilt structure does not require.
But “fixed” should not be confused with “identical everywhere.” A fixed-tilt project can still contain different table configurations or fixed-angle zones when the project design requires them. The difference is that those tables do not actively track the sun after installation.
Start With an Apples-to-Apples Comparison
A comparison becomes weak as soon as the two alternatives use different boundaries. Keep the important project assumptions consistent, including:
- site and weather data
- module technology
- bifacial assumptions
- electrical configuration
- inverter loading ratio
- buildable land boundary
- GCR / row-spacing assumptions
- loss assumptions
- analysis period
- financial boundary
The 2024 NREL Annual Technology Baseline[2] is a good example of why configuration matters. Its representative utility-scale PV technology uses one-axis tracking, bifacial performance assumptions, and a defined inverter loading ratio; it also identifies axis type, bifaciality, shading, downtime, ILR, and inverter losses among the factors affecting modeled capacity factor.
The same discipline applies to cost data. The U.S. Department of Energy’s 2025 utility-scale PV cost benchmark[3] defines a representative 100 MWdc utility-scale PV system using bifacial modules on single-axis trackers, together with a defined inverter configuration, land area, and cost boundary. That benchmark is useful because the system is clearly defined; it is not a universal fixed-tilt-versus-tracker comparison.
How Much More Energy Does a Solar Tracker Produce?
Single-axis tracking can increase annual generation relative to a defined fixed-tilt baseline. There is not, however, one tracker uplift percentage that should be applied to every project.
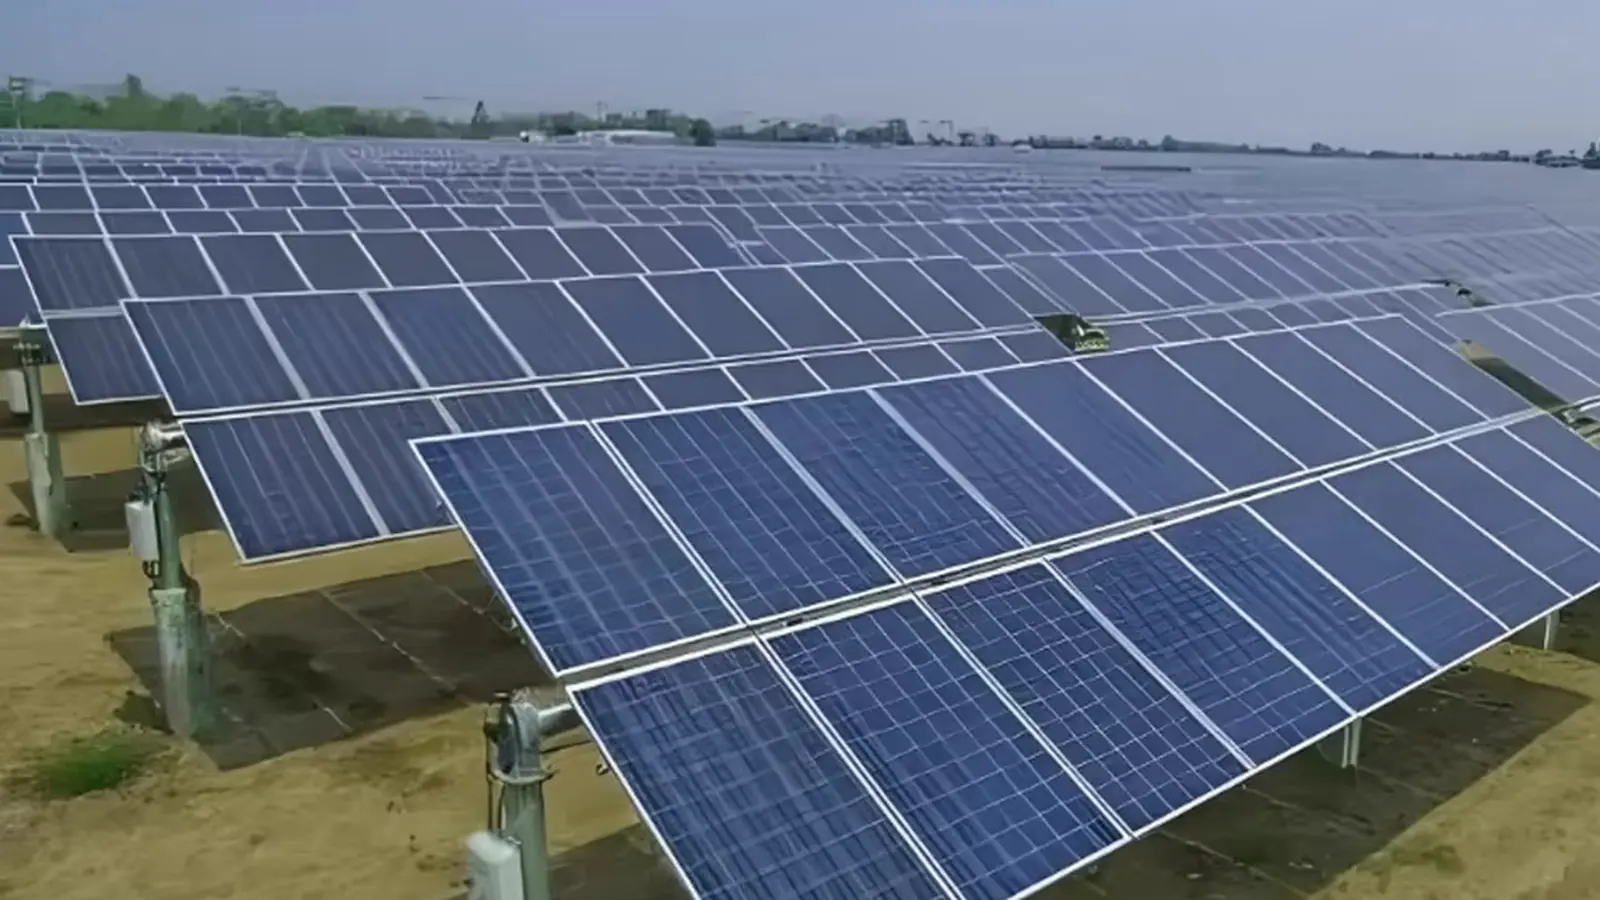
Solar-resource composition is one reason. U.S. EIA analysis of tracking and direct-beam irradiance[4] explains that tracking is particularly useful for direct-beam radiation because modules can remain better oriented toward the sun. Diffuse radiation arrives from many directions and therefore does not provide the same tracking benefit.
Geometry matters as well. Relevant variables include GCR, row pitch, shading, backtracking, terrain, module technology, bifaciality and albedo, electrical losses, and inverter loading.
Rolling terrain can make the geometry even more project-specific. Sandia research on single-axis trackers over rolling terrain[5] accounts for factors including cross-axis slope, different row rotation angles, and tracker geometry when calculating shading and backtracking.
Compared with what fixed-tilt baseline, at what site, and under what assumptions?
That is the question to ask whenever a report or supplier presents a generic tracker gain. The number that matters is the difference between two consistently modeled project alternatives.
More MWh Does Not Automatically Mean More Project Value
Annual modeled generation is only the first step. The project still needs to convert that energy difference into usable and economically relevant output.
Yield-to-Value Waterfall
Modeled energy → Usable AC energy → Exportable / non-curtailed energy → Commercially relevant energy → Project value
One reason for the distinction is inverter clipping[6]. Sandia defines clipping as a condition in which array DC power exceeds the applicable inverter input capability, so AC output does not continue to rise proportionally with additional available DC power.
Other project boundaries can include interconnection/export limits, curtailment, plant availability, time-dependent electricity value, storage configuration, and the PPA or tariff structure.
Berkeley Lab’s 2025 U.S. Utility-Scale Solar data update[7] treats performance, CapEx, O&M, LCOE, PPA pricing, wholesale market value, and net value as distinct analytical dimensions and includes project-level data for U.S. utility-scale solar.
Incremental modeled generation and incremental economic value are not automatically the same number.
This distinction becomes especially important where clipping, export constraints, curtailment, storage, or time-dependent energy values are material.
Land Efficiency: MW per Acre and MWh per Acre Are Not the Same Thing
“Which system uses land more efficiently?” can refer to several different metrics. Those metrics should not be collapsed into one generic land-use claim.
Power Density
MWdc/acre measures how much installed DC capacity fits within the project footprint.
Specific Yield
kWh/kWp/year measures how much annual energy each unit of installed PV capacity produces.
Energy Density
MWh/acre/year measures how much annual energy the complete site produces per unit of land.
Berkeley Lab’s Land Requirements for Utility-Scale PV study[8] explicitly distinguishes power density in MW/acre from energy density in MWh/acre and analyzes both fixed-tilt and tracking plants.
Land Efficiency Triangle
MWdc/acre ↔ kWh/kWp/year ↔ MWh/acre/year
A design can improve one metric without necessarily maximizing another. Instead of asking only “Which system needs more land?”, ask both how much DC capacity fits inside the buildable boundary and how much annual energy that entire land boundary produces.
Terrain Affects Both Energy Modeling and Project Scope
“Flat site = tracker; sloped site = fixed tilt” is too simple a design rule. Rolling terrain does not automatically eliminate tracking, but the actual tracker geometry, structural limits, foundation requirements, controls, and construction tolerances still have to be verified for the proposed equipment.
The Sandia rolling-terrain tracker study[5] shows why terrain can affect shading and backtracking calculations. Separately, terrain may change civil and foundation requirements depending on the proposed system and site.
The DOE Nevados uneven-terrain tracker case[9] is a useful bounded example: it describes one specific tracker technology designed for uneven terrain and discusses grading as a project budget and schedule consideration. It should not be generalized into a claim that all trackers eliminate grading.
Terrain belongs in both the energy/layout analysis and the civil/construction analysis.
What Does a Real Fixed-Tilt Project Look Like? A 316.47 kW EASYSOLAR Solar Mounting System Example
First-Party Project Example
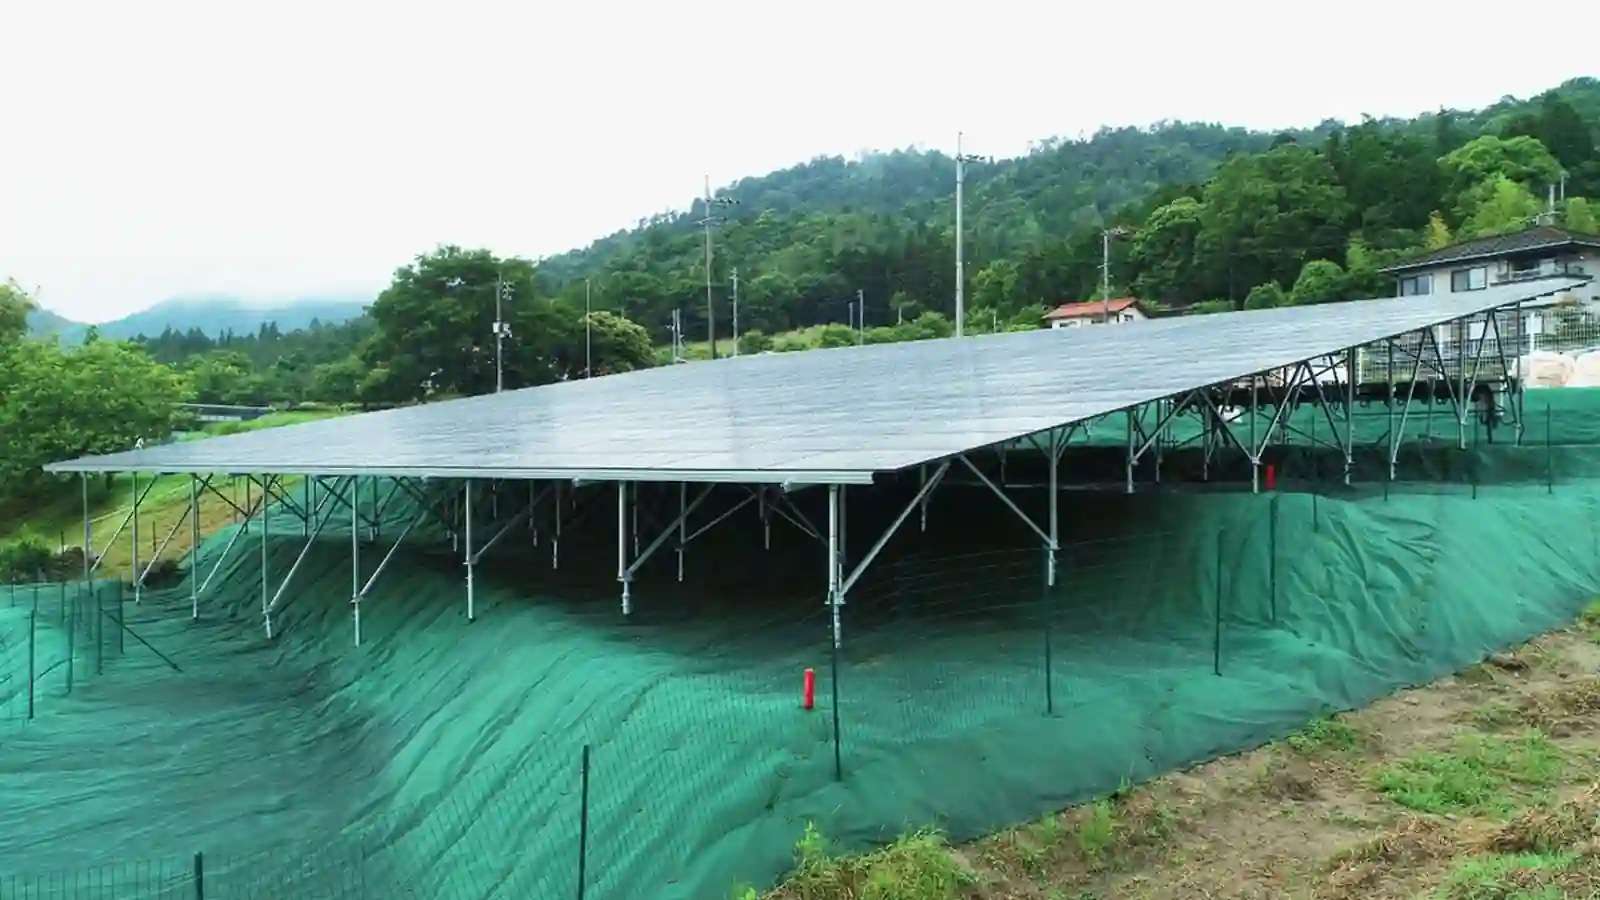
A real EASYSOLAR engineering case illustrates why “fixed tilt” should not be interpreted as “one standard rack repeated everywhere.” The ground-mount PV project in Gunma, Japan had a nominal capacity of 316.47 kW and used 959 modules rated at 330 W each.
The project engineering schedule contained multiple mounting-table configurations and included fixed-angle groups at 10°, 20°, and 30°. The documentation also included site and design inputs associated with structural and mounting work, including wind, snow, ground clearance, and implementation requirements.
For readers evaluating real fixed-tilt implementation, EASYSOLAR’s ground-mount project examples provide additional context on how mounting requirements vary between projects.
What the Case Demonstrates
A fixed-tilt project does not necessarily use one identical mounting configuration across the entire site.
Even without an active tracking mechanism, the final mounting design can still need to reconcile site conditions, PV equipment, structural and mounting requirements, foundations, installation constraints, and the final project configuration.
If a project comparison ultimately favors fixed tilt, the next step is to define a project-specific ground solar mounting system rather than selecting a generic rack solely from a comparison table.
What the Case Does Not Demonstrate
The available engineering sheet does not establish why the 10°, 20°, and 30° groups were selected. It also does not demonstrate that multiple tilt angles increased yield, reduced grading, lowered project cost, or outperformed a tracker. Those conclusions would require additional project documentation or comparative modeling.
The project figures are a project-specific implementation example, not design recommendations for another site.
Compare Lifetime Cost, Not Just Mounting Hardware Price
The commercial question should not be reduced to “Which rack costs less?” The two architectures can change different parts of the project scope.
For a tracker proposal, the scope may include tracker structures, drives and moving components, controls, communications or power for tracking, commissioning, and tracker-specific inspection or maintenance requirements. For a fixed-tilt proposal, the absence of tracker mechanisms does not make the remaining scope generic; structure configuration, foundations, civil work, installation, logistics, and engineering can still depend on the project.
DOE’s 2025 solar PV system cost benchmark[3] illustrates the breadth of a utility-scale cost boundary, including O&M categories beyond mounting hardware alone.
Why This Article Does Not Quote a Universal Tracker Premium
The current DOE benchmark page used here defines a representative single-axis-tracking utility-scale system. It does not provide a same-page, same-scope current fixed-tilt benchmark from which this article can derive a universal tracker premium.
Use current fixed-tilt and tracker quotations under the same project scope, then compare the incremental cost.
Reliability, O&M, and Weather: Compare Consequences, Not Component Counts
Trackers add the mechanisms and controls required to move the array, and those components belong in the O&M and reliability analysis. More components alone, however, do not prove lower lifecycle reliability.
A more useful evaluation asks what can fail, how much capacity would be affected, how long recovery would take, what spare parts and service actions are required, and what evidence supports expected availability.
Failure likelihood × capacity affected × downtime × economic consequence
This is a conceptual decision aid, not a fleet-reliability statistic.
Hail
DOE’s hail-damage mitigation guidance for PV systems[10] discusses tracker hail-stow strategies that can move modules to steeper positions under certain hail conditions. Hail stow should be evaluated as part of a site-specific structural and operational strategy, not treated as an automatic safety guarantee.
Wind and Snow
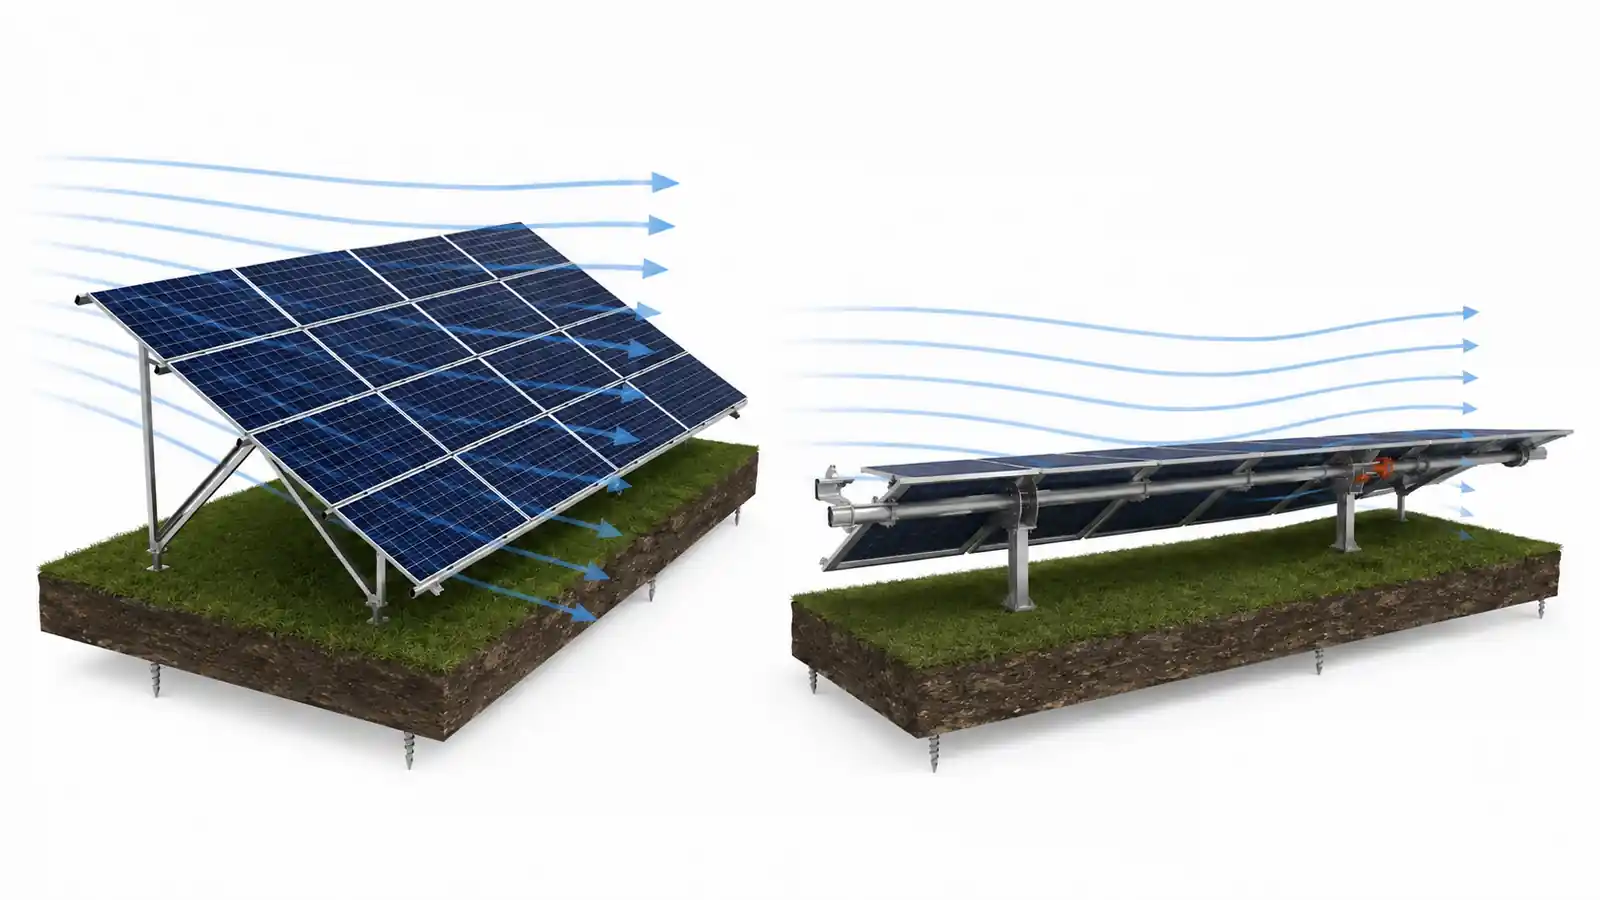
For both architectures, actual wind and snow performance should be evaluated using the proposed product’s structural documentation and the project design loads. Without comparative product evidence, this article does not declare either technology the universal wind or snow winner.
Bifacial Modules Do Not Make the Decision Automatic
Bifacial modules and single-axis tracking are widely paired at utility scale, but bifaciality does not turn the comparison into a simple rule.
The IEA PVPS 2024 report on bifacial tracking systems[11] reviews current best practices and emphasizes technology- and site-specific factors such as tracking algorithms, layout, weather response, reliability, and yield modeling.
Consistent-Baseline Rule
Do not take a tracker gain from one unrelated study and a bifacial gain from another, then add them together as if they were a project forecast.
Different studies can use different locations, fixed-tilt baselines, GCRs, albedos, module technologies, tracker geometries, and loss assumptions. Tracker and bifacial contributions can be separated within one internally consistent analysis, but the comparison should stay inside one defined baseline and methodology.
When Does the Business Case Move Toward Tracking or Fixed Tilt?
There is no defensible universal threshold, but project results can push the business case in a clear direction.
| Project Finding | Directional Implication |
| Tracking creates a meaningful increase in usable energy | Strengthens the tracker case |
| Incremental tracker energy occurs at commercially valuable times | Strengthens the tracker case |
| Tracker CAPEX/OPEX increment is small relative to incremental value | Strengthens the tracker case |
| Incremental usable-energy value from tracking is limited | Strengthens the fixed-tilt case |
| Tracker-specific lifecycle burden is high relative to added value | Strengthens the fixed-tilt case |
| One architecture is materially penalized by real terrain, structural, grid, or product constraints | Strengthens the alternative, subject to modeling |
| Results are close and uncertain | Sensitivity analysis matters more than a generic industry rule |
The table is deliberately directional. It does not mean that a fixed tracker-yield percentage, slope threshold, or project-size threshold should determine the choice.
A Practical Fixed-Tilt-vs-Tracker Decision Framework
1. Model Both Alternatives Consistently
Use the same site, weather dataset, module assumptions, electrical boundary, land boundary, and study period.
2. Calculate Incremental Usable Energy
Move beyond gross modeled production and account for relevant clipping, export, curtailment, and availability assumptions.
3. Compare Land and Terrain Outcomes
Evaluate MWdc/acre, kWh/kWp/year, MWh/acre/year, real layout geometry, and relevant foundation or civil consequences.
4. Compare Current Same-Scope CAPEX and Lifecycle OPEX
Avoid historical generic percentages when actual project quotations are available.
5. Verify Actual Structural and Operational Requirements
Check the proposed equipment rather than relying on category assumptions. For fixed-tilt projects, EASYSOLAR’s engineering support can be used to translate site, module, structural, foundation, and installation inputs into the mounting discussion.
6. Calculate Incremental Lifetime Value
Conceptually:
ΔNPV = -ΔCAPEX + PV(Δ Usable Energy Value) – PV(ΔOPEX) – PV(Δ Quantifiable Risk)
This is an Incremental Value Test, not a complete financial model. If tracking’s additional usable lifetime energy creates enough value to exceed its incremental lifecycle burden, tracking may have the stronger business case. If it does not, fixed tilt may be the more rational choice.

What This Article Cannot Determine Without Project Data
A comparison article cannot determine several project-specific outputs reliably without the actual project inputs. It cannot tell you:
- the tracker yield uplift for your site
- the correct fixed-tilt angle for your site
- the correct tracker or fixed-tilt GCR
- the exact land requirement of either layout
- your current fixed-versus-tracker CAPEX delta
- your lifecycle O&M difference
- a product’s slope limit or tracker stow capability
- project-specific wind or snow capacity
- project LCOE or NPV
- which architecture is better for your parcel
These are not omissions that should be filled with industry averages. They are project inputs that need to be modeled or verified.
For EPC and developer workflows, EASYSOLAR also provides EPC solar mounting solutions for projects that move forward with fixed-tilt mounting.
What to Verify Before Accepting a Mounting Proposal
Before selecting either architecture, verify the assumptions behind the exact proposal:
- module compatibility and layout basis
- terrain and foundation assumptions
- structural design basis
- wind and snow requirements
- tracking/stow logic where applicable
- maintenance scope
- replacement/spares strategy where applicable
- warranty terms
- quote inclusions and exclusions
- evidence behind claimed yield, cost, installation, or reliability advantages
What site, baseline, model, and system boundary produced that number?
That question is often more useful than the percentage itself.
How This Comparison Was Built?
This guide separates independent category-level evidence from EASYSOLAR first-party project evidence. Technical statements about tracking behavior, solar resource, clipping, land density, terrain, cost methodology, bifacial tracking, and weather considerations rely primarily on independent public sources from Sandia National Laboratories, NREL, the U.S. Department of Energy, the U.S. Energy Information Administration, Lawrence Berkeley National Laboratory, and IEA PVPS.
The 316.47 kW EASYSOLAR example is used only to show what a real fixed-tilt mounting configuration can look like. It is not treated as a tracker comparison, scientific benchmark, or proof of category superiority.
Fixed Tilt vs Solar Tracker: The Bottom Line
Single-axis tracking can produce more energy than a defined fixed-tilt baseline. Fixed tilt avoids the active mechanisms and controls required to track the sun. Neither statement is enough to select a project.
Consistent modeling → Incremental usable energy → Land and terrain → Lifecycle cost → Structural and operational verification → Incremental lifetime value
The EASYSOLAR first-party case adds one practical lesson on the fixed-tilt side: fixed tilt can be mechanically simpler without being a one-size-fits-all mounting design.
If the project analysis favors tracking, the technical conclusion should say so. If it favors fixed tilt, the next step is to convert the real site, module, structural, foundation, and installation requirements into an engineered mounting configuration.
Verify the project. Don’t assume a universal winner.
Planning a Fixed-Tilt Ground-Mount Project?
If your project analysis points toward fixed tilt, EASYSOLAR can discuss the site, module, structural, foundation, and installation requirements needed to define the next mounting-system configuration. Discuss Your Fixed-Tilt Project.
Publishing note: The project example is intentionally bounded to the data available in the supplied engineering case. The article does not claim the 10°/20°/30° groups were caused by terrain, improved yield, reduced grading, or proved fixed tilt superior to tracking.
References
All third-party evidence links have been removed from the article body. The complete external source list is consolidated below, with full URLs for review and publishing QA.
[1] Sandia National Laboratories – Single-Axis Tracking – PV Performance Modeling Collaborative
https://pvpmc.sandia.gov/modeling-guide/1-weather-design-inputs/array-orientation/single-axis-tracking/
[2] National Renewable Energy Laboratory (NREL) – 2024 Annual Technology Baseline – Utility-Scale PV
https://atb.nrel.gov/electricity/2024/utility-scale_pv
[3] U.S. Department of Energy – Solar Photovoltaic System Cost Benchmarks
https://www.energy.gov/cmei/systems/solar-photovoltaic-system-cost-benchmarks
[4] U.S. Energy Information Administration – Solar Tracking and Direct-Beam Irradiance Analysis
https://www.eia.gov/todayinenergy/detail.php?id=30912
[5] Sandia National Laboratories – Shaded Fraction and Backtracking in Single-Axis Trackers on Rolling Terrain (2024)
https://www.sandia.gov/research/publications/details/shaded-fraction-and-backtracking-in-single-axis-trackers-on-rolling-terrain-2024-03-01/
[6] Sandia National Laboratories – Inverter Saturation or Clipping – PV Performance Modeling Collaborative
https://pvpmc.sandia.gov/modeling-guide/dc-to-ac-conversion/inverter-saturation-or-clipping/
[7] Lawrence Berkeley National Laboratory – U.S. Utility-Scale Solar, 2025 Data Update
https://emp.lbl.gov/publications/us-utility-scale-solar-2025-data
[8] Lawrence Berkeley National Laboratory – Land Requirements for Utility-Scale PV
https://emp.lbl.gov/publications/land-requirements-utility-scale-pv
[9] U.S. Department of Energy – Nevados Tackles Siting Challenges with Innovative Solar Trackers
https://www.energy.gov/cmei/systems/articles/success-story-nevados-tackles-siting-challenges-innovative-solar-trackers
[10] U.S. Department of Energy – Hail Damage Mitigation for PV Systems
https://www.energy.gov/cmei/femp/hail-damage-mitigation-pv-systems
[11] IEA PVPS Task 13 – Best Practices for the Optimization of Bifacial Photovoltaic Tracking Systems (2024)
https://iea-pvps.org/key-topics/best-practices-for-the-optimization-of-bifacial-photovoltaic-tracking-systems/
Note: EASYSOLAR links to pvmountsystem.com remain embedded in the article because they are internal navigation links. All third-party/external links are listed only in the References section above.

Sales Manager at Easy Solar Solar Mounting Systems. With over 1o years of experience in the solar industry, I specialize in providing reliable andcost-effective mounting solutions for distributors, installers, and EPC companies. Experienced in intemational sales and commited to building long-term partnerships worldwide.